The gap between the highest and lowest value in a series of numbers is called the range of a data set. To get the range of the provided data points, subtract the set’s biggest value from its lowest value.
In order to evaluate data and provide insightful interpretations, range is a crucial notion in statistics. From the range, what can you infer about the data? It provides information on the data’s variability, the distribution of the data points, and the separation between the greatest and lowest values.
What is Range in Math: Definition
Range In math is defined as “the difference between the maximum and least values that are present in a set. The easiest and fastest method for understanding the provided data points is to use range“.
Example:
What is the range of a Set Of numbers {21,82,56,89,47} ?
The largest value = 89
The smallest value = 21
Therefore, the range is 89-21 = 68.
It indicates the distance between the largest value in the set and the smallest number. Greater variability is indicated by a wider range, while lower variability in a distribution is shown by a shorter range.
“Book a free Assessment for Maths Tutor “
Formula for Finding Range of a Data Set
As previously stated, the difference between the highest and lowest observation in the provided data is the range of a set of numbers. Range In math can be found using the following formula:
Range = Highest value – Lowest value
Finding Range of a Data Set using Graphs
If a plot of the data set, like a bar graph or scatter plot, is provided, you can also use it to calculate the range.

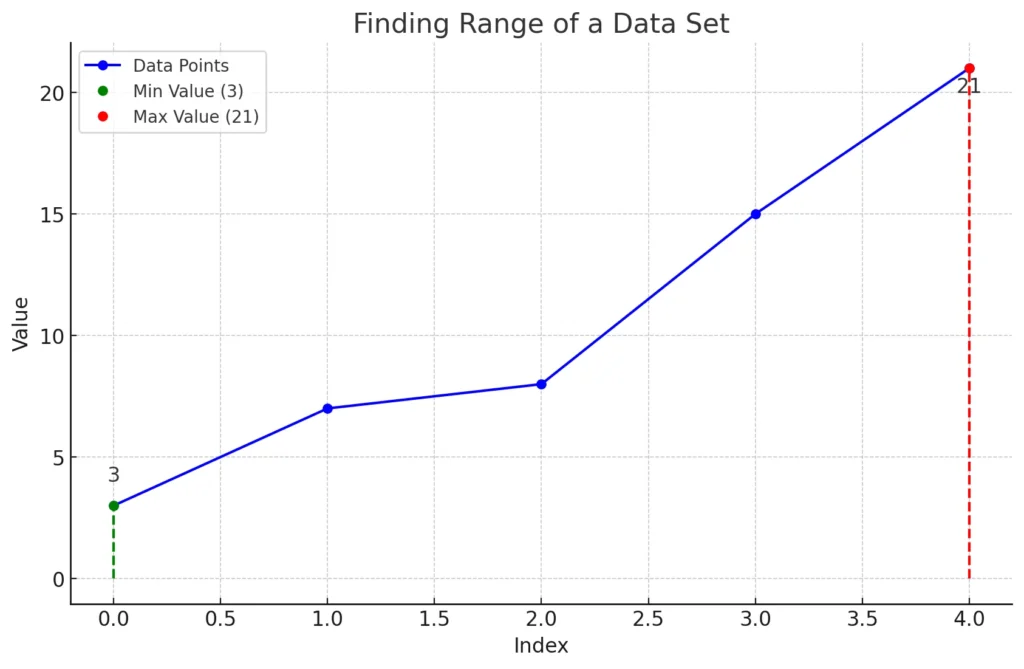
- The data points (3, 7, 8, 15, 21) are plotted.
- The minimum value (3) is highlighted in green.The maximum value (21) is highlighted in red.
- The dashed vertical lines indicate the range from the minimum to the maximum value.
- Range is 21-3 = 18.
Advantages of Range
- The range is used to quickly assess how widely distributed the data is or to gain a quick understanding of the data’s variability.
- The simplest method for interpreting the data’s distribution is to use range.
- Range is useful for comparing similar-sized tiny data sets.
- Simple to calculate
- Range analysis has many uses in quality control.
Range of a Function
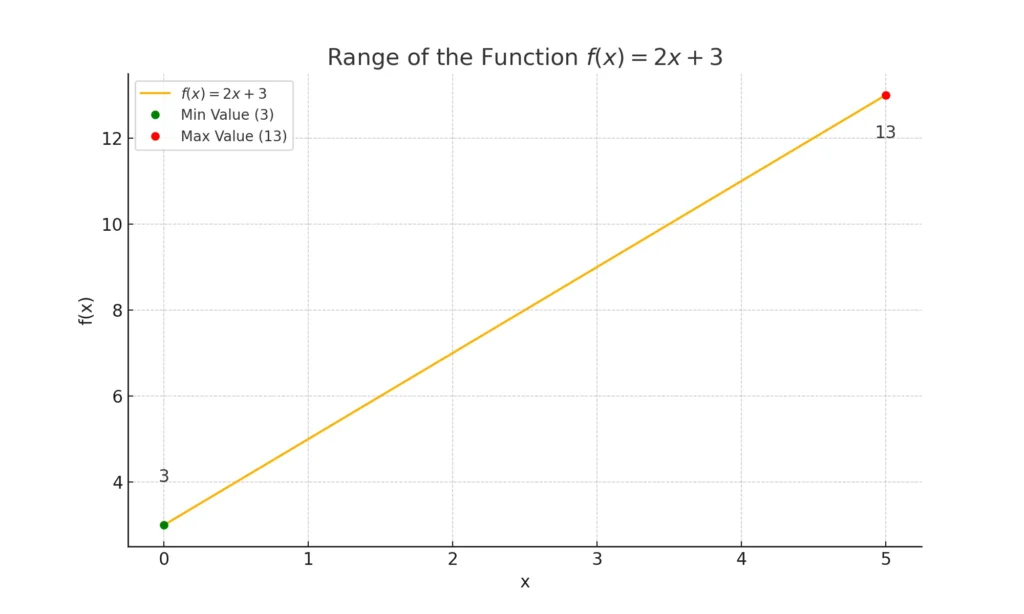
f(x)=2x+3
Domain x∈[0,5]
f(0)=2(0)+3=3
f(5)=2(5)+3=13
- The minimum value of f(x) in this domain is 3.
- The maximum value of f(x) in this domain is 13.

What is a Range in Algebra?
In algebra, the range refers to the set of all possible output values (y-values) of a function, based on its domain (x-values). It represents all values that the function can produce.
Example,
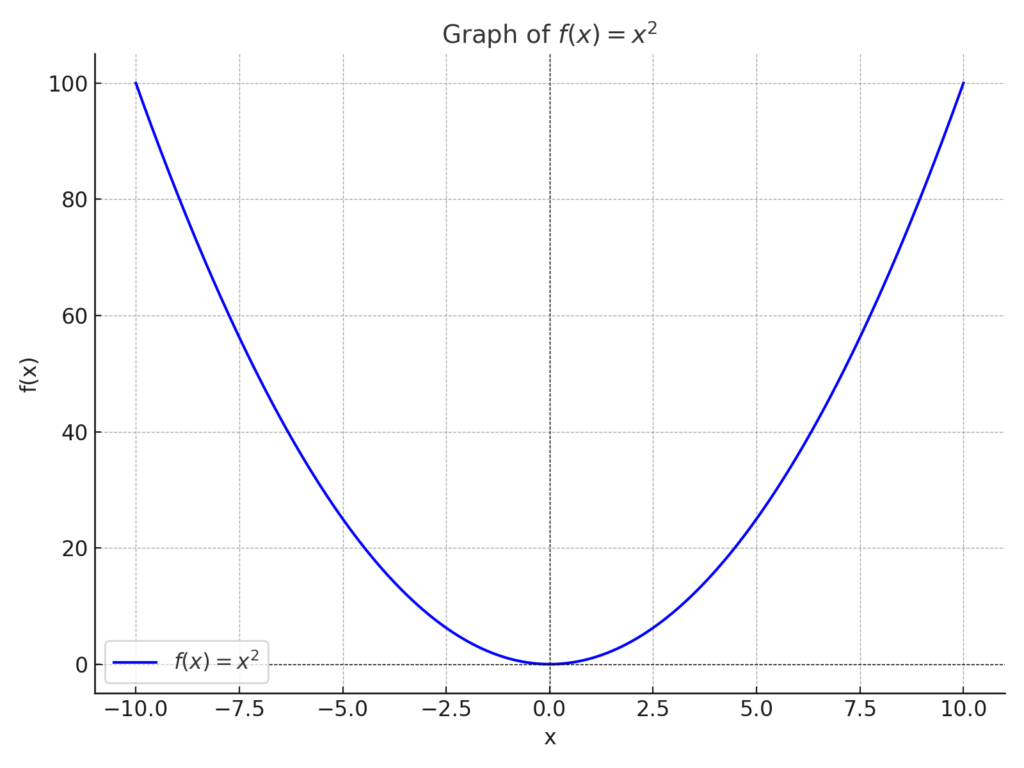
For the function f(x)=x2:
- The domain (input) includes all real numbers (−∞,∞).
- The range (output) is all non-negative real numbers (0,∞) because squaring any real number results in a non-negative value.
Graph,
The graph of f(x)=x2 is a parabola opening upwards. The lowest point is at (0, 0), and it extends infinitely upward, demonstrating that the range is y≥0.

Read More Significance Of GCSEs: Why These Exams Matter In Your Academic Journey

